SoapUI is rather memory intensive, especially with default settings for logging, etc. If you are running more lengthy functional tests or load tests you might well bump into an OutOfMemory error. Fortunately, there are several things that can be done to minimize the risk for running into this error.
1. Adjust Memory Settings
This doesn't really solve the underlying problem, but if you have large WSDLs, requests, attachments, etc the default settings in "bin\soapui.bat", "bin\soapui.sh", "bin\soapUI-Pro-5.2.0.vmoptions" for Windows or "Contents/vmoptions.txt" for Mac won't be sufficient. Open the corresponding file in a text editor and change the line
set JAVA_OPTS=%JAVA_OPTS% -Xms128m -Xmx256m -Dsoapui.properties=soapui.properties
to use higher values for the max allocated size, for example:
set JAVA_OPTS=%JAVA_OPTS% -Xms128m -Xmx768m -Dsoapui.properties=soapui.properties
The exact value is hard to say, it depends of course on your system setup, other applications running, etc. You can set it to half the amount of available memory, for example on a machine with 2 GB of ram that would be 1024. Remember that if you are running a 32-bit operating system (for example Windows XP), then you wont be able to allocate more than approximately 1.5Gb, so there is no use in setting the value higher then that.
If you run into PermGen errors (for example if you are using a lot of groovy scripts), then you might need to adjust that setting as well, add a -XX:MaxPermSize setting to the above line:
set JAVA_OPTS=%JAVA_OPTS% -Xms128m -Xmx768m -XX:MaxPermSize=128m -Dsoapui.properties=soapui.properties
If you want to dig into all possible memory-related options, check out Joe Mocker's Collection of JVM Options.
2. TestCase Memory Usage
One common memory-hog is a long-running functional TestCase, usually data-driven and thus running through thousands of requests. By default, SoapUI automatically saves the entire request-response message exchange for each request so it can be viewed by double-clicking the corresponding entry in the TestCase log. Obviously this will fill up memory over time no matter how much you have allocated, but fortunately there are ways to discard old results from memory if not needed.
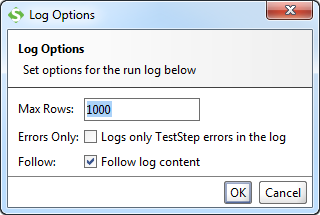
There are two options at play here, let's take the easy one first: the TestCase Log Options available via the toolbar on top of the TestCase Log:

The first two of these options control how many entries are visible in the Log (and thus indirectly in memory), the main purpose of this dialog is to make the log more readable. Just because they are removed from the log does not mean they are removed from memory since you might still want to access them using a groovy script that for example creates a custom report over all executed TestSteps after the Test has finished, in which case you would still need access to all results.
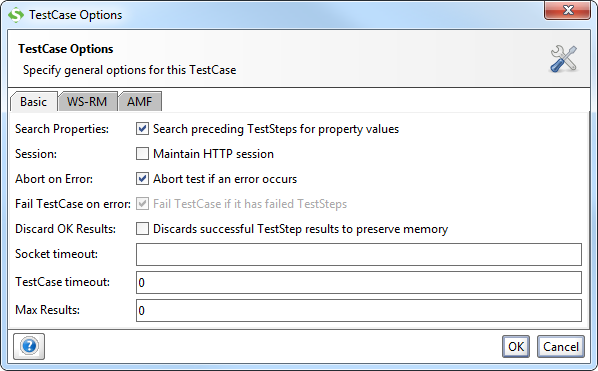
The real settings for controlling memory usage are in the TestCase Options dialog:

The options at play are:
- Discard OK Results : Selecting this will discard the content of any successful TestStep Result that would otherwise have been viewable by double-clicking the corresponding result in the TestCase Log.
- Max Results : Controls how many TestStep Results are kept in memory in total, regardless of their state. Setting this to 0 will keep all in memory but allow LoadTests to discard them if possible. If you don't want LoadTests to discard them, set this to a very high value.
Be aware that if a TestStep Result is discarded (either because it is OK and should be discarded, or is beyond the limit set in the second option above), it will still be held in memory if it is visible in the log. Thus the Log Options and TestCase Options need to harmonize so that they don't hold on to old Results when they shouldn't.
When running from the command-line there is no Log, so in that scenario only the TestCase Options are applicable.
Conclusion: Always select the Discard OK Results and set the Max Results to a reasonably high value when running tests in production, as always depending on your specific requirements.
2.1. Important 1: TestStep Discard Responses
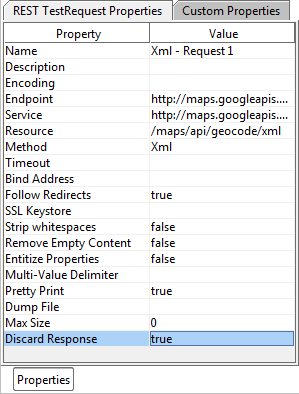
If you want to discard responses in order to bring memory usage down, you also need to configure that on the TestStep level.

Make sure that Discard Responses set to True for the involved TestSteps.
Note: If you keep the Response Editor open it will override this setting and still collect responses. So, in order to completely discard responses, you also need to close the Response Editor.
2.2. Important 2: Close window
Something that might not be obvious (or maybe it is), is that you also need to close the response window. Otherwise, the responses will be collected no matter what setting you have, in order to be displayed in the window.
3. LoadTest Memory Usage
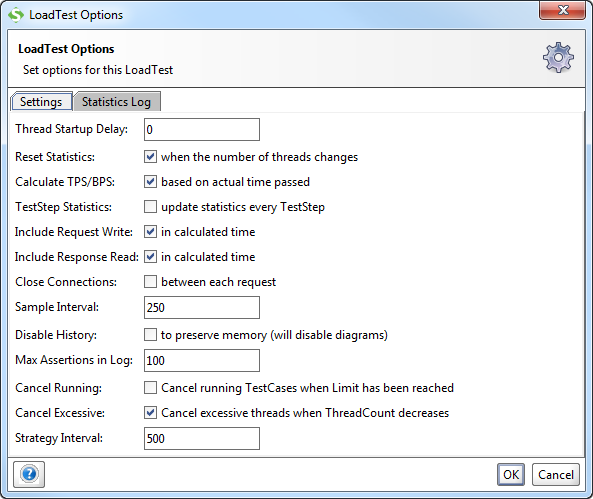
LoadTests are bound to be memory hogs over time since they gather a number of statistics on the executed TestCases and TestSteps. Here the LoadTest Options dialog also has two settings that affect memory usage:

- Disable History - this turns off collection of statistics visible in the diagrams. An obvious memory-saver, if you still need statistics use the Statistics Log tab to have these exported continuously for later analysis.
- Max Assertions in Log - this is more or less the same as with the TestCase Log, assertions removed from the log (and their underlying requests) will be removed from memory unless the underlying TestCase Options say otherwise.
TestStep results that violate a LoadTest assertion will be kept in memory regardless of the underlying TestCase Options so the underlying TestStep Result can be viewed by double-clicking the corresponding entry in the Assertion Log (unless they are rolled out first of course).
Conclusion: turn off the statistics history and use the Statistics Log for long running Tests, and follow the same recommendations for the underlying TestCase as stated above.
4. MockService Memory Usage
MockServices can also hog memory, since the log holds on to all received requests so they can be viewed by double-clicking them. Here you have two ways to control their behavior:
- Disable the log altogether by unchecking the Enable checkbox in the Log toolbar
- Set the max number of rows to reasonably low value (default is 100)
Since the default is rather low (100), this shouldn't pose an issue, but if you are running LoadTests against your MockService it might be a good idea to disable the log to keep down log-processing.