Using LoadUI Pro for load testing
SoapUI offers basic load testing capabilities. If you want to get more out of your load testing, ReadyAPI with ReadyAPI has more capabilities for the professional load tester. You can use your SoapUI tests with ReadyAPI and get more visibility into server performance and how your application behaves under stress.
Download LoadUI Pro and Start Performance Testing
1. Using SoapUI for load testing
Basics
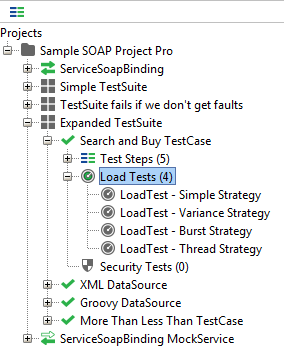
In SoapUI, LoadTests are based on existing functional TestCases. A LoadTest runs the TestCase repeatedly for the specified time with a desired number of threads (or virtual users). LoadTests are shown in the Navigator as children to the TestCase they use. For example, on the image below, the Search and Buy TestCase has four LoadTests defined:
You can create any number of LoadTests for your TestCase by using the New LoadTest command. You can find it in the the context menu in the Navigator panel, or on the TestCase editor toolbar.
After you created a LoadTest, SoapUI will open its editor automatically. You can also open the editor any time by double-clicking a LoadTest in the Navigator.
1.1. LoadTest Execution
SoapUI allows you to run your LoadTest with as many threads (or virtual users) as your hardware can manage, depending mainly on memory, CPU, target service response-time, and other factors. Set the desired value and start the LoadTest with the  Run button at the LoadTest editor toolbar.
The underlying TestCase is cloned internally for each configured thread and started in its own context; scripts, property-transfers, etc. The TestCase will access a unique "copy" of the TestCase and its TestSteps which avoids threading-issues at the TestStep and TestCase level (but not higher up in the hierarchy).
If your TestCase modifies Test Suite or Project properties, this will be done on the common shared ancestor objects. The "Thread Startup Delay" setting in the LoadTest Options dialog can be used to introduce a delay between the start of each thread, allowing the target services (or soapUI) some "breathing space" for each thread.
Depending on which limit and strategy has been selected, the LoadTest will run as configured until it terminates due to one of the following:
- It has reached its configured limit.
- It has been canceled by the user with the Cancel button on the LoadTest toolbar.
- It has been canceled by a LoadTest Assertion when the maximum number of allowed errors for that assertion has been passed.
If the limit is time-based, the Cancel Running option in the LoadTest Options dialog allows you to control if running threads should be allowed to finish or should be cancelled. In the same manner, the "Cancel Excessive" option controls if excessive threads should be cancelled when the thread-count decreases (for example, when using the Burst Strategy).
Multiple LoadTests can be executed in parallel to test more advanced scenarios. Just open several windows at once and run them side-by-side. A sample scenario for this could be a recovery test consisting of a simple LoadTest generating baseline traffic and another LoadTest using the Burst Strategy which creates high traffic in Bursts; after each Burst the baseline LoadTest can check that the system handles and recovers as required.
1.2. Statistics Collection
As the LoadTest runs, the LoadTest statistics table is continuously updated with collected data each time an executed TestCase finishes, allowing you to interactively monitor the performance of your target service(s) while the LoadTest executes. If your TestCase contains a loop or long-running TestSteps it may take some time for the statistics to update (since they are collected when the TestCase finishes), in this case select the “TestStep Statistics” option in the LoadTest Options dialog to get updated statistics on the TestStep level instead of TestCase level (this requires a bit more processing internally which is why it is turned off by default).
Collection and calculation of statistic data is performed asynchronously (i.e. independently from the actual TestCase executions), so it will not directly affect the actual LoadTest execution. Further, the Statistics Interval setting in the LoadTest Options dialog controls how often the Statistics table is updated from the underlying statistics model, change this value if you require more or less frequent updates.
Quick tip: Several Strategies also allow you to change the number of threads during execution, which enables you to interactively change the load and monitor the results as the LoadTest progresses. If you want reset the calculated statistics when the number of threads changes (so numbers like avg and tps are not skewed by previous results), make sure Reset Statistics in the LoadTest Options dialog is selected.
1.3. TPS / BPS Calculation
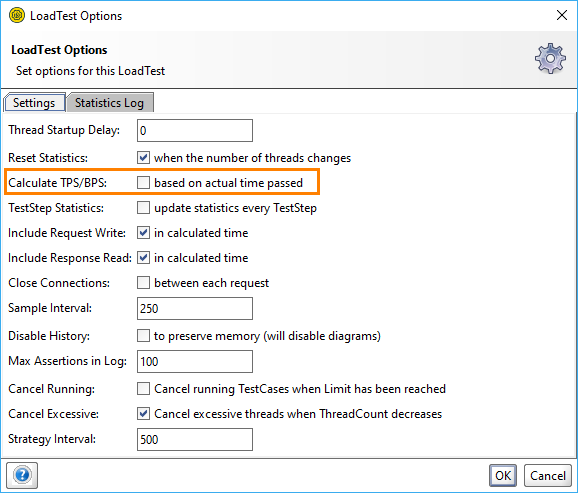
Calculation of the different values in the Statistics table is straight-forward for all columns except TPS (transactions per second) and BPS (bytes per second) which can be calculated in two different ways (controlled by the "Calculate TPS/BPS" setting in the LoadTest Options dialog);
- Based on actual time passed (default):
- TPS: CNT/Seconds passed, i.e. a TestCase that has run for 10 seconds and handled 100 request will get a TPS of 10
- BPS: Bytes/Time passed, i.e. a TestCase that has run for 10 seconds and handled 100000 bytes will get a BPS of 10000.
- Based on average execution time:
- TPS: (1000/avg)*threadcount, for example avg = 100 ms with ten threads will give a TPS of 100
- BPS: (bytes/CNT) * TPS, i.e. the average number of bytes per request * TPS.
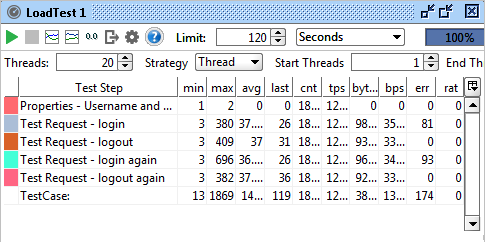
To better understand the difference between these two, let's create a small example; a TestCase with two groovy scripts, the first sleeping for 900ms, the second for 100ms. We'll run this with 10 threads for 10 seconds, which theoretically should result in 100 executions of our TestCase;

With TPS being calculated on time passed, the value is the same for both TestSteps since they were executed the same number of times during our 10 seconds. Their individual execution speeds does not affect this value.
Now let’s change the way TPS is calculated to be based on average (in the LoadTest Options dialog):
When we now run the test we get the following:
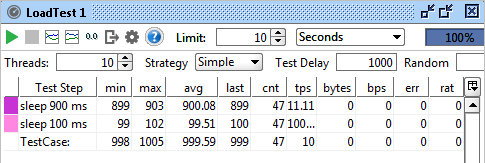
Here the hypothetical TPS for the first teststep is calculated to be 11, since with 10 parallel runs the average time was 909ms. The second teststep gets 100 TPS, once again calculated with 10 parallel runs which took 99ms in average (if this was sustained performance we could theoretically have "squeezed in" 100 requests in each second).
Which of these two to use is up to you; with single step TestCases you should get roughly the same result from both, but when your TestCases contain many steps, both ways have their pros and cons (as illustrated above).
Statistics Graphs
There are two types of graphs available from the LoadTest Toolbar during execution; statistics and statistics history. The main purpose of these is to visualize selected statistics over time to be able to detect sudden and unexpected changes. Display of statistics is relative (not absolute) and the graphs are thus not very useful for analyzing exact data. Both graphs have a Resolution setting which controls how often the graph is updated; setting this to "data" will update the graph with the same interval as the Statistics Table (which is the underlying data for the graph, hence the name). Alternatively if you want one of the fixed resolutions select these.
The Statistics Graph shows all relevant statistics for a selected step or the entire testcase over time, allowing you to see how values change when you for example increase the number of threads:
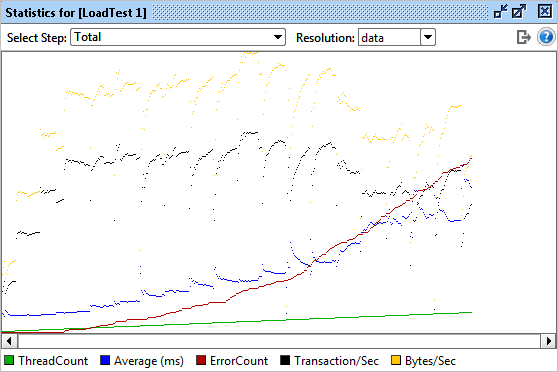
As you can see the green line (threads) jumps up after half the test, which also causes an expected jump in average and a minor change in transactions per second, the later meaning that although we increase the number of threads we don't get a corresponding increase in throughput (since the average response time increases).
The Statistics History Graph shows a selected statistic value for all steps allowing you to compare them and see if the distribution of any value between teststeps changes over time. For the same test we can compare the avg over time:
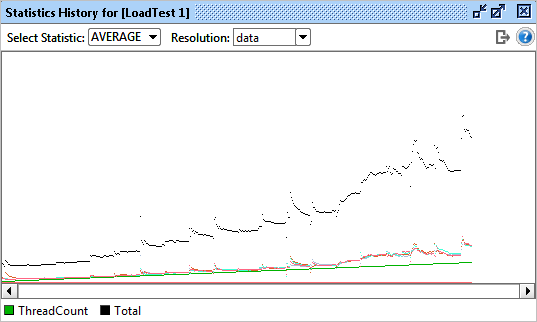
The graph above contains one line for each TestStep in our TestCase shown with the same color as the TestStep in our Statistics table:
As we can see the average changes similarly for both TestSteps when the number of Threads increases.
1.4. TestStep Specific Things to keep in mind
The multi-threaded execution of LoadTests has some TestStep-specific implications that you should be aware of when designing and running your LoadTest:
- Run TestCase: If your TestCase contains “Run TestCase” steps, their target TestCase will not be cloned for each Thread in the LoadTest; all threads will each execute the same instance of the target TestCase. The "Run Mode" option in the Run TestCase Options Dialog is available for controlling behavior in this situation; set it to either "Create isolated copy..." (Which will do just that) or "Run primary TestCase (wait for running to finish, Thread-Safe)” which will synchronize access to the target TestCase. The "Create isolated copy" will give better performance but any changes made to the internal state of the target TestCase will be lost for each execution.
- DataSource: DataSources can be shared between threads in a LoadTest, allowing you to "divide" the threads between the data that you are using to drive your tests. This can come in handy but does have some configuration-implications that you should understand, read more here: Data-Driven LoadTests.
- DataSink: Just like DataSources, DataSinks can also be shared, resulting in all threads writing to the same DataSink. Remember that a shared DataSink will be used for all Threads during the entire run of the LoadTest, which could amount to quite a lot of data.
- DataGen : DataGen properties can be set to be shared between threads, which can be useful with DataGen Number Properties which are used for generating unique ID's (if the property is not set to be shared, each thread will get the same sequence of numbers).
Ok! Hope this gets you going. Next up is how to use the different Load Strategies for simulating different types of load, and then we'll move on to assertions, reporting and script. What fun!
No one knows APIs better than SmartBear. Find out what our Pro version of SoapUI can do to improve your testing.